
Meal Photo Logging vs Calorie Counting: Which One You Will Actually Stick To
This question comes up almost every week. Someone has tried a calorie app, lasted eleven days, and wants to know whether snapping a photo of every meal instead would be easier, or more accurate, or both. It is a completely fair question. It also has an answer most fitness content will not give you.
Start with the honest part: the trial does not exist
There is no head to head study comparing meal photo logging against calorie counting for weight loss or for how long people stick with it. Not one. If you read an article that tells you photos win on adherence, or that counting wins on accuracy, that writer is guessing and dressing the guess up as science.
I am not going to do that. What I can do is walk you through what the research does say about each piece, because there is enough there to make a sensible decision, and because the gaps themselves are useful information.
What we do know: how often you log matters more than how long it takes
The best single finding on this comes from a study of 142 people tracking their food over 24 weeks, published in Obesity by Harvey and colleagues. Two things came out of it. First, people got faster at logging as the months went on, dropping from about 23 minutes a day to about 15. Second, and this is the part that matters, the amount of time people spent logging did not predict how much weight they lost. The frequency did. People who lost at least 5 percent of their body weight logged around 2.4 times a day, against 1.6 times a day for those who did not. Among the people who lost 10 percent or more, it was 2.7 times a day against 1.7 (Harvey et al., 2019).
Read that again, because it reframes the whole question. The winning method is not the accurate one. It is the one you open three times a day instead of once, every day, for months.
The wider evidence on self-monitoring points the same way but points more softly. A review of 22 studies found a consistent association between tracking your food and losing weight, and the authors were careful to add that the level of evidence was weak because of how the studies were designed, and that the people in them were mostly white and mostly women (Burke, Wang and Sevick, Journal of the American Dietetic Association, 2011). So: tracking is associated with results, on evidence that is genuinely soft. Anyone selling you certainty here is overselling.
Where the photo shortcut gets shaky
The pitch for photo logging is that a camera plus an AI does the hard part for you. So how good is the AI?
The clearest test I have seen fed 52 standardised food photos to general purpose AI models and compared their estimates against food that had actually been weighed. The better performers were off by an average of about 36 percent on energy. One model was off by anywhere from 64 to 110 percent. Every model tested underestimated, and here is the ugly detail: they got worse as the portions got bigger. The authors concluded that this accuracy is roughly comparable with traditional self reported dietary assessment, and that it is not yet suitable for precise dietary assessment (Fridolfsson et al., 2025).
Sit with the direction of that error for a second. It reads low, and it reads lower the more food is on the plate. That is precisely the wrong way round for someone trying to lose fat. The big plate is the one you most need an honest number on.
A separate seven day study put a real phone based computer vision app against a laboratory measure of energy expenditure. The app under-estimated intake, and a spoken 24 hour recall under-estimated it by a similar amount. The two methods did not differ from each other (Lee et al., Journal of Nutritional Science, 2025). So the camera is not obviously worse than describing your day to a dietitian. It is also not magic.
And when researchers looked at where AI food analysis breaks down, the answer was blunt: challenges persist in quantifying nutrient contents, particularly for composite or visually ambiguous dishes (Wang et al., 2026). Composite. Visually ambiguous. Mixed together in a bowl so you cannot see what is in it.
Now think about what we actually eat here
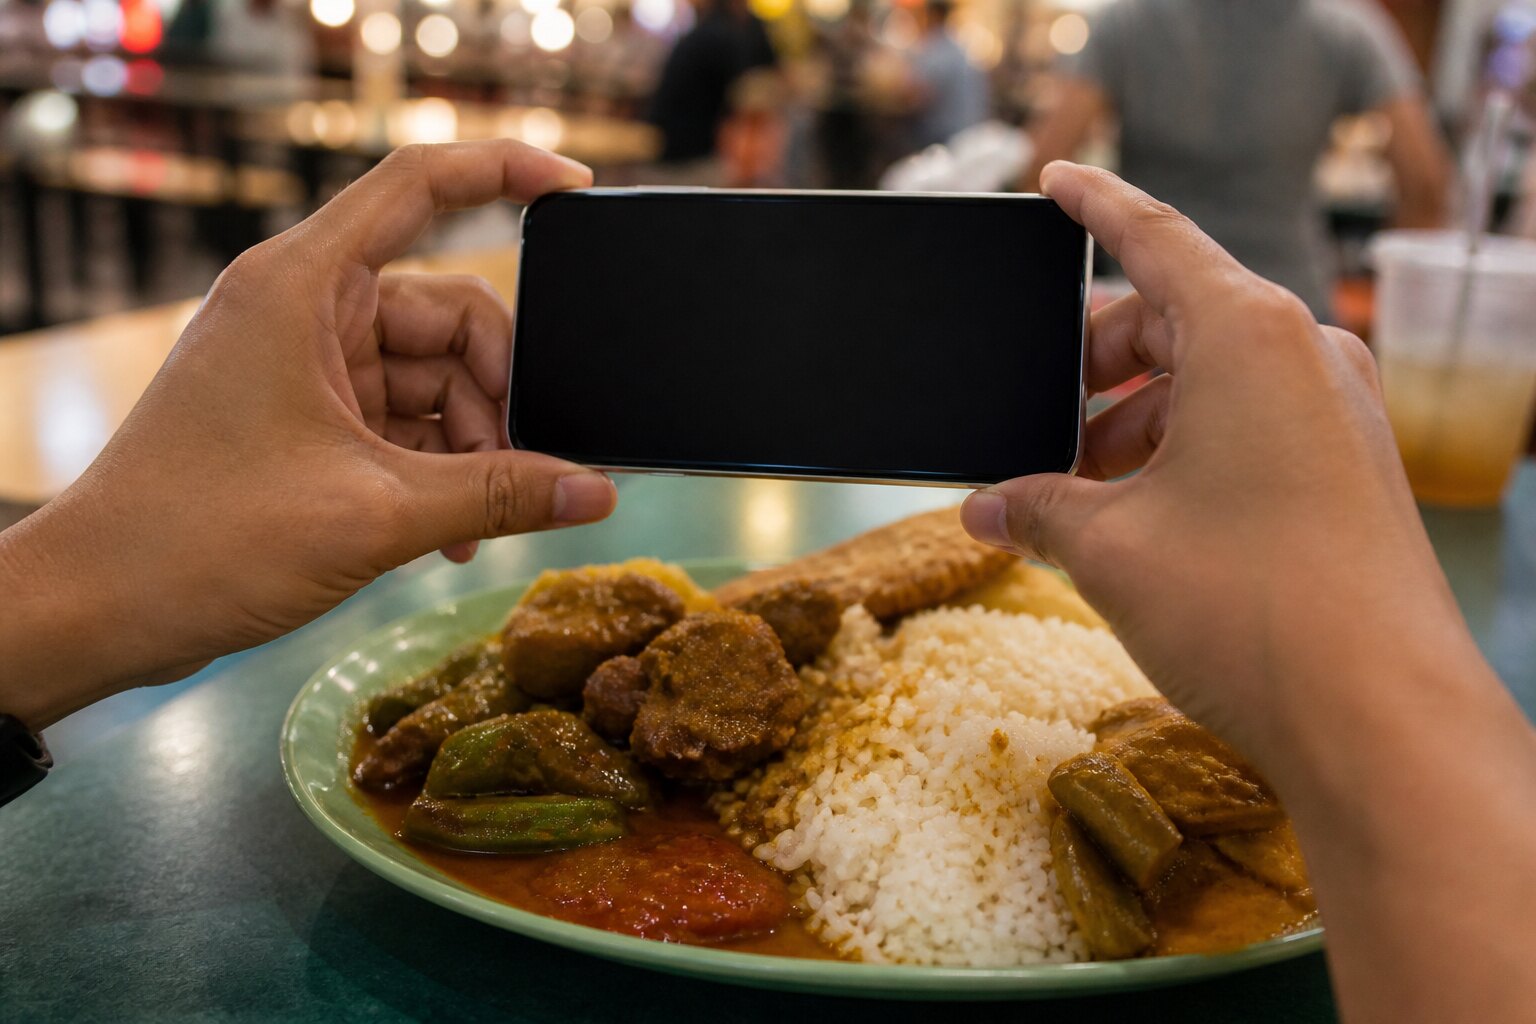
Chicken rice. Mee rebus. Nasi padang, where the whole point is that you cannot see how much oil is in the rendang. Laksa. Char kway teow. Economy rice, where the same scoop of curry vegetables might be swimming in gravy or drained.
These are composite, visually ambiguous dishes. They are the documented failure case, and they are most of what my clients eat.
Here is the gap I want you to know about: there is no published evaluation of AI or photo calorie tools on Singaporean hawker food at all. Nobody has run it. So when an app confidently tells you your cai png was 620 calories, that number has not been validated against anything resembling your lunch. It might be close. It might not. Nobody has checked.
I would go further and say we should expect it to be worse here rather than better, for the two reasons above: local dishes sit squarely in the category the researchers flagged as hardest, and the underlying food databases have their own problems, which brings me to the other side of this.
Counting has its own accuracy problem, and it is not the one you think
People assume manual calorie counting is the accurate option and photos are the lazy one. The database says otherwise.
A 2024 study in JMIR mHealth and uHealth tested five calorie tracking apps across 836 food codes, checking them against national food composition tables. Four of the five under-estimated saturated fat, by between roughly 14 and 40 percent. Every one of them under-estimated cholesterol, by between roughly 26 and 60 percent. One app was missing nearly half its saturated fat data, another was missing most of its cholesterol data in its Chinese language version. The variation within a single app for the same food ran extremely high. The authors traced the errors past the reference tables to the apps themselves, concluding that the app’s core database is the source of the problems (Ho et al., 2024).
That last part deserves emphasis. This was not a study about people picking the wrong entry. The entries were wrong.
Then there is us. In a Danish study of 120 adults where energy expenditure was measured properly rather than estimated, 34 percent of people came out as under-reporters on a seven day food diary. On a shorter recall method it was 4 percent (Biltoft-Jensen et al., 2023). The longer the diary, the more the tracking quietly drifts away from what was eaten. Not from dishonesty. From fatigue.
So what do I actually tell people
Given all of that, here is how I coach it, and I want to be clear that this is my judgement as a coach and not a research finding.
- Pick whichever one you will still be doing in week nine. Frequency is the variable with evidence behind it. A method you use three times a day beats a more precise method you abandon.
- Treat the number as a signal, not a measurement. Both methods under-count. If your number is consistently wrong in the same direction, the trend over weeks still tells you something useful, even when the daily figure does not.
- Photos are better at capturing the thing counting misses. A photo shows the portion, the gravy, the second plate, the time on the clock. That context is often where the real problem lives.
- Do not trust an automated estimate of a local dish. Not because it is definitely wrong, but because nobody has ever checked whether it is right.
This is exactly why Fit Lab has a human look at the photos. Not because I have a proprietary algorithm that beats the research, I do not. It is because the documented failure cases are mixed local dishes, opaque databases and long-diary drift, and a coach who has seen ten thousand plates of cai png can look at your photo and say “that gravy is doing more damage than the rice” in a way no database entry currently can. The photo is the conversation starter. I am the correction layer.
One last thing. If you have a history of disordered eating, or tracking food sends you somewhere dark, neither of these tools is neutral for you, and that is a conversation for your doctor before it is one for a coach. Please speak to a medical professional about anything that touches your health.
Sources
- Harvey et al., 2019. Obesity. Dietary self-monitoring frequency, time spent, and weight loss over 24 weeks. https://doi.org/10.1002/oby.22382
- Burke, Wang and Sevick, 2011. Journal of the American Dietetic Association. Systematic review of self-monitoring in weight loss (22 studies).
- Fridolfsson et al., 2025. Current Developments in Nutrition. Accuracy of general-purpose AI models estimating energy and nutrients from 52 standardised food photographs. https://doi.org/10.1016/j.cdnut.2025.107556
- Wang et al., 2026. Current Research in Food Science. Review of AI in dietary assessment, including composite and visually ambiguous dishes. https://doi.org/10.1016/j.crfs.2026.101405
- Lee et al., 2025. Journal of Nutritional Science. Seven-day comparison of a computer-vision food app and 24-hour recall against indirect calorimetry.
- Ho et al., 2024. JMIR mHealth and uHealth. Nutrient accuracy of five calorie-tracking app databases across 836 food codes. https://doi.org/10.2196/54509
- Biltoft-Jensen et al., 2023. British Journal of Nutrition. Under-reporting on a 7-day food diary versus 24-hour recall, validated by doubly labelled water. https://doi.org/10.1017/s0007114523000454
Not sure where you actually stand?
Answer seven questions and get your own daily calorie and protein target, plus a realistic date for your goal weight. Free, and no payment details.