
Almost everyone who sits down with me for the first time opens with the same line. “Coach, I know already, I need to stop eating hawker food.” My answer is always the same. No, you don’t.
I eat at hawker centres. Most of the people I coach eat there two or three times a day, because that is what is downstairs, that is what is open at 3am after a shift, and that is what the family is eating. A plan that begins by deleting all of that is a plan you will quit in a fortnight, and quitting is the only real failure here.
So here is what actually drives fat loss, and how to work with the food already in front of you.
Fat loss runs on a calorie deficit, not on a food list
The cleanest evidence on this comes from a controlled feeding study where 25 adults lived in a metabolic unit for eight weeks and were deliberately overfed by roughly 954 calories a day on low, normal or high protein diets. Total weight gain differed between the groups, but as Bray and colleagues reported in JAMA in 2012, body fat increased similarly in all three groups and “calories alone account for the increase in fat”.
The same picture shows up when people are trying to lose. A network meta-analysis of 48 randomised trials covering 7,286 people found that at 12 months, low-carbohydrate diets produced 7.25 kg of loss and low-fat diets 7.27 kg, and the authors concluded that this “supports the practice of recommending any diet that a patient will adhere to”. DIETFITS, 609 adults over a year, found 5.3 kg on low fat against 6.0 kg on low carb. And in POUNDS LOST, 811 adults on four different macronutrient combinations all landed between 2.9 and 3.6 kg at two years with no significant difference, while what actually predicted weight loss was attendance, at about 0.2 kg per session attended.
Read that last one twice. Turning up beat the diet type. That is the whole argument for eating food you actually like.
Swap one: soup instead of dry
This is the single highest-leverage swap in a Singapore hawker centre, and it is free. All the dish figures below come from the Health Promotion Board’s Singapore Food Insights Database, its Energy and Nutrient Composition data.
| Dish | Portion | Calories | Protein |
|---|---|---|---|
| Bak chor mee, dry | 430 g bowl | 563 kcal | 21.7 g |
| Bak chor mee, soup | 682 g bowl | 539 kcal | 39.1 g |
| Ban mian, dry | 407 g bowl | 676 kcal | 28.8 g |
| Ban mian, soup | 792 g bowl | 610 kcal | 25.7 g |
Look at the bak chor mee row again. The soup bowl is 250 g heavier, has 24 fewer calories, and carries nearly double the protein. A bigger, hotter, more filling bowl for less.
Swap two: how it is cooked beats what it is called
Yong tau foo is the clearest example in the whole database. Under one dish name, HPB lists a seven-piece clear soup bowl at 594 calories per 771 g when the pieces are mixed, and 1,206 calories per 928 g when they are all fried. Same stall, same order, double the calories, decided entirely by which pieces you point at.
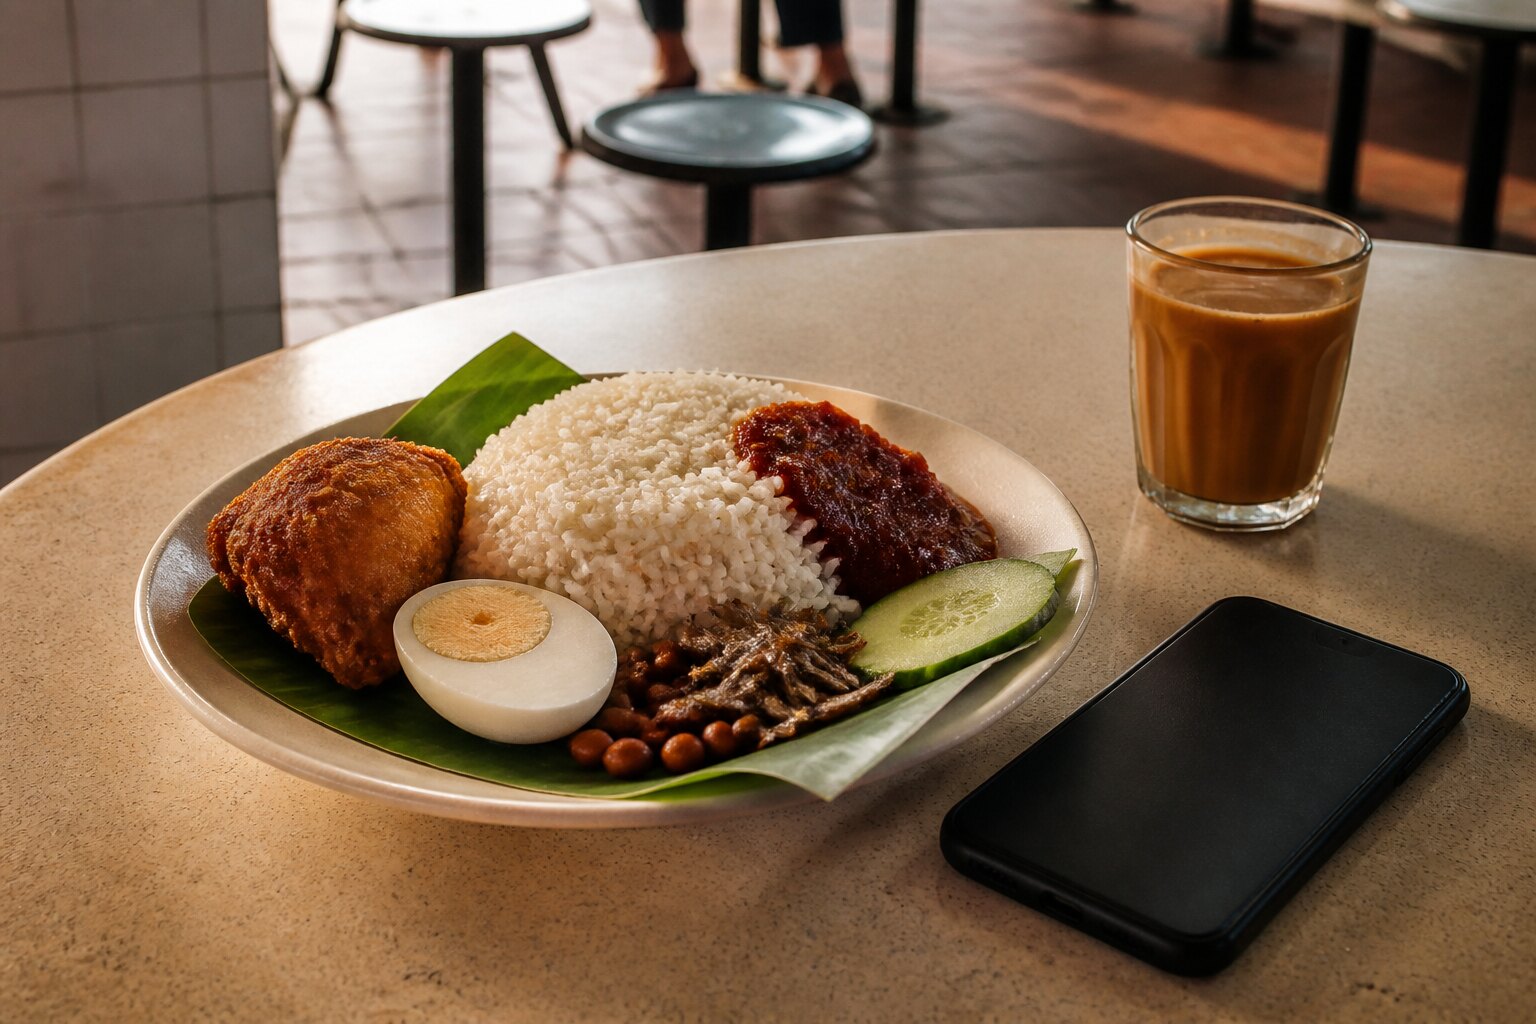
Same story elsewhere. Steamed chicken rice comes in at 488 calories per 346 g plate against roasted at 643 calories per 363 g. A nasi lemak fish set is 707 calories per 349 g plate; the chicken cutlet set is 922 calories per 399 g. You did not change your order. You changed one word in it.
Swap three: kosong
HPB’s database puts a 250 ml kopi at 193 calories and a kopi O kosong at 33. Teh is 150 calories; teh O kosong is 5. If you drink two a day, that one word is roughly 300 calories a day without touching a single meal. HPB’s consumer guidance puts a teh at about five teaspoons of sugar, a kopi at about four, and any “O kosong” at zero.
One honest note. Every kopi and teh entry in HPB’s database is marked Derived rather than lab analysed, with teh tarik the sole exception at 72 calories per 150 ml cup. Treat the drinks numbers as good estimates, not measurements. The direction of the swap is not in doubt.
Swap four: the cai png trap
This one catches good people. HPB lists nineteen economy rice combinations spanning 609 to 1,238 calories. Three vegetables comes to 809 calories per 770 g plate with 20.2 g of protein. One vegetable plus one meat comes to 697 calories per 553 g plate with 34.5 g of protein.
The vegetable-only plate is worse on both counts, because cai png vegetables are cooked in oil and the meat is where the protein lives. Healthy-looking and lower-calorie are two different things.
Protein per calorie is not what you would guess
If I rank the database by grams of protein per 100 calories, sliced fish soup without milk sits near the very top of the cooked dishes at 20.3, which is 17.1 g of protein in an 84-calorie, 561 g bowl. Char kway teow sits at the bottom of the mains at 2.6, with 25.7 g of protein inside a 989-calorie, 480 g plate.
That is not a reason to never eat char kway teow. It is a reason to know which dishes buy you protein cheaply, so the ones that don’t can stay on the menu.
If you want one number to carry around, HPB’s own Healthier Dining Programme guidelines set a “Lower in Calories” main meal at 500 calories or less, weighing at least 150 g, and they are explicit that “healthier meals that are at 500 calories or below need not be lesser in portion.” A smaller plate is not the goal. A better-built plate is.
Treat the numbers as a guide, not a verdict
I want to be straight about how solid these figures are, because most Singapore calorie articles are not.
HPB’s own database lists char kway teow at 989 calories per 480 g plate. HPB’s consumer site HealthHub lists 744 calories per 384 g. Both are HPB. The 744 figure traces back no further than a 2014 food blog post attributed to a private dietitian with no stated method, then recycled for over a decade by a news site and by a hospital group. I am not going to tell you which number is right. The database entry is the better documented of the two, and that is as far as I will go.
Peer-reviewed work does not settle it either. Yeo and colleagues lab-analysed 45 local meals in Foods in 2021, but everything was purchased from a single food court operator, and their laksa came out at 153 calories per 100 g against HPB’s 71. Professor Henry of A*STAR, one of the authors, put it plainly: “the calorie and macronutrient profiles of many local foods have yet to be extensively determined.”
So use the numbers the way a coach uses them. To rank options against each other, not to audit your day to the calorie.
The two habits that beat any swap list
First, log more often rather than longer. In a 24-week study of 142 people, time spent logging fell from 23.2 to 14.6 minutes a day and did not predict weight loss at all, but frequency did: people who lost at least 5% logged 2.4 times a day against 1.6 for those who didn’t. Ten seconds, three times a day, beats a careful half hour on Sunday.
Second, expect to under-count. When 120 Danish adults had their real energy expenditure measured with doubly labelled water, 34% came out as under-reporters on a seven-day food diary. That is normal human behaviour, not dishonesty. It means that if the scale is stuck after a few weeks, check the logging before you blame your metabolism.
One caution about salt
Calories are not the only axis. The database lists laksa at 3,086 mg of sodium per 604 g bowl and mee soto at 4,068 mg per 622 g bowl, against HPB’s recommended daily limit of 2,000 mg. Soup dishes tend to be the salty ones, and you do not have to finish the broth. If you have high blood pressure, kidney problems, diabetes, or you are pregnant, please talk to your doctor before making changes to how you eat. Nothing here is medical advice and no way of eating treats or prevents a condition.
What I would actually ask you to do this week
Pick two swaps. Order kosong, and take the soup version of whatever noodle you already eat. Change nothing else. Two swaps you keep for a year will move you further than a perfect plan you abandon by month end, and that is not motivational talk, that is what the attendance data in POUNDS LOST is telling us.
The hawker centre is not the problem. It never was.
Sources
- Health Promotion Board, 2026. Singapore Food Insights Database, Energy and Nutrient Composition of Food. https://pphtpc.hpb.gov.sg/web/sgfoodid/tools/food-search
- Bray GA et al., 2012. Effect of dietary protein content on weight gain, energy expenditure, and body composition during overeating. JAMA. https://doi.org/10.1001/jama.2011.1918
- Johnston BC et al., 2014. Comparison of weight loss among named diet programs in overweight and obese adults. JAMA. https://doi.org/10.1001/jama.2014.10397
- Gardner CD et al., 2018. Effect of low-fat vs low-carbohydrate diet on 12-month weight loss (DIETFITS). JAMA. https://doi.org/10.1001/jama.2018.0245
- Sacks FM et al., 2009. Comparison of weight-loss diets with different compositions of fat, protein, and carbohydrates. NEJM. https://doi.org/10.1056/nejmoa0804748
- Hall KD and Guo J, 2017. Obesity energetics: body weight regulation and the effects of diet composition. Gastroenterology. https://pmc.ncbi.nlm.nih.gov/articles/PMC5568065/
- Yeo J, Bi X, Yeo PLQ and Henry CJ, 2021. Energy and macronutrient contents of 45 local meals in Singapore. Foods. https://doi.org/10.3390/foods10071659
- Harvey J et al., 2019. Log often, lose more: electronic dietary self-monitoring for weight loss. Obesity. https://doi.org/10.1002/oby.22382
- Biltoft-Jensen A et al., 2023. Misreporting of energy intake against doubly labelled water. British Journal of Nutrition. https://doi.org/10.1017/s0007114523000454
- Health Promotion Board, 2026. Healthier Dining Programme Nutrition Guidelines, July 2026. https://isomer-user-content.by.gov.sg/484/adbf6cfc-050b-413d-80dc-a22b350cf9d6/HDP%20Nutrition%20Guidelines%20-%20July%202026.pdf
Not sure where you actually stand?
Answer seven questions and get your own daily calorie and protein target, plus a realistic date for your goal weight. Free, and no payment details.